El Niño Data Breaks the Chart — Here’s What That Means for Engineers
Sea-surface temperature readings in the Niño 3.4 region have left the historical envelope. This isn't a model — it's observed data, and its implications for infrastructure, food systems, and climate resilience are massive.
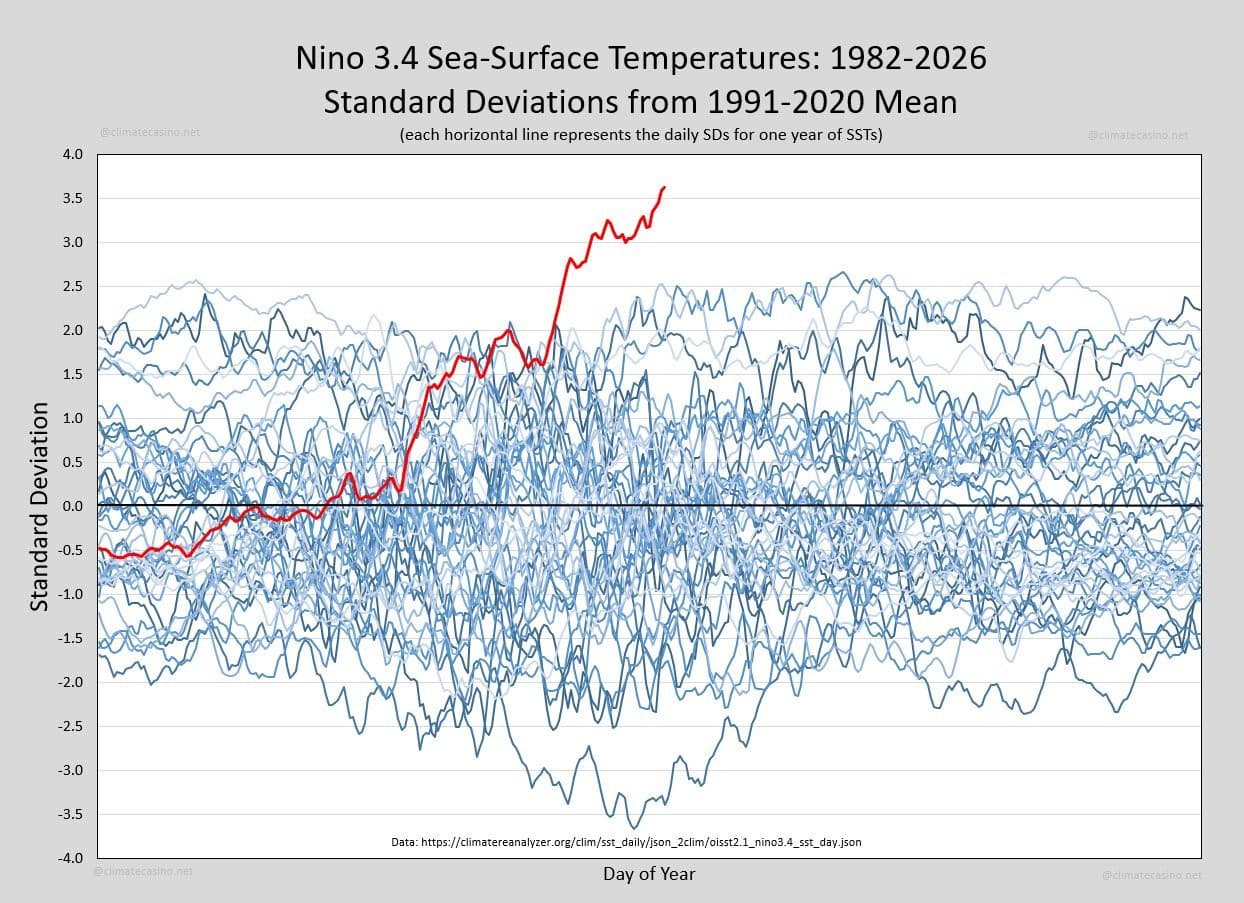
Every so often, the Earth produces a signal that can't be ignored. This one comes from the Niño 3.4 region of the equatorial Pacific — a patch of ocean that drives global weather patterns. The graph shows sea-surface temperatures for every year since 1982 as blue lines. The red line is this year. It doesn't just set a new record. It has departed entirely from the range of previous observations.
This isn't a computer model or a forecast. These are direct measurements from satellites, ships, and ocean buoys. Reality is unfolding now.
Why This Matters for Infrastructure and DevOps
The El Niño–Southern Oscillation is the beating heart of the Earth's climate system. When the Niño 3.4 region warms, it alters atmospheric circulation, redistributes rainfall, and amplifies extreme weather. Australia gets hotter and drier — more drought, more bushfires. South America gets heavier rain and flooding. Asia faces severe drought. These aren't abstract problems. They affect data center cooling, supply chains for hardware, agricultural output, and energy grids.
Human activities have pumped enough CO₂ into the atmosphere to raise the baseline temperature of the tropical Pacific. Every El Niño now starts from a warmer ocean. That means more energy in the system: more evaporation, more moisture in the atmosphere, storms with more fuel, and longer, hotter heatwaves. Climate change doesn't eliminate natural variability — it amplifies it.
What Engineers Should Watch
The oceans regulate atmospheric circulation, transport heat, and drive rainfall patterns that sustain forests, grasslands, and agriculture. When ocean temperatures move outside the historical range, ecosystems unravel. Coral reefs bleach. Fish migrate. Kelp forests collapse. Oxygen levels drop. Marine heatwaves become common.
These ecological impacts feed back into the climate system. Scientists describe Earth as a network of interconnected tipping elements: the Atlantic Meridional Overturning Circulation, Greenland's ice sheet, West Antarctica's glaciers, Arctic sea ice, and the Amazon rainforest are all under stress. Changes in one trigger changes in others, sometimes in unexpected ways.
For engineers building infrastructure, this means rethinking assumptions about weather extremes, energy reliability, and supply chain resilience. The historical data we used to design systems is no longer a reliable guide. We're entering conditions that our infrastructure, ecosystems, and institutions were never designed to accommodate.
The Bottom Line
This graph isn't about proving catastrophe is inevitable. It's about showing that the Earth is moving beyond the range within which modern human civilization developed. The question is whether we're willing to pay attention and act before the changes become too large, too rapid, and too interconnected for us to manage.
Discussion
0 Comments
Be the first to start the discussion.